Archive
Mystery Solved?
In my previous post from June 2012, I noted that the Vancouver housing market was stalling and mortgage rules had been tightened. I fully expected a housing correction to follow — possibly a major one. What followed was a minor seven month correction of -5.0%, followed by a subsequent gain of 14.9% in the Teranet House Price Index.

Considering Vancouver had already been rated the second-least affordable housing market by Demographia, this recovery was hard to understand. As I continued to watch the market, I tried to look for an explanation. Other than the usual housing bubble rationalizations — everyone wants to live here, we’re running out of land, etc. — the conventional wisdom for recent gains seemed to be low interest rates. But even with historically low rates, housing affordability was already near record lows. It doesn’t seem plausible that already-strained households have been able to keep the party going for so long.
 A market driven by low mortgage rates should look more like this:
 I also noticed a clear disconnect between the first phase of the bubble (2002-2008) and the second phase (2009-present). During the first phase, all of the Canadian bubble markets increased in a similar fashion. As an example, compare the price history of Victoria and Vancouver.
 The first peak occurred in mid-2008. Up until then, both markets moved together. But after the initial recovery in 2009, Vancouver began to behave differently than Victoria and other Canadian markets. Over the last 5-6 years, something very different has been going on here. In my opinion, the difference has been foreign buying — mostly from Mainland China. Unfortunately, there is no hard data on the amount of foreign ownership, so I’ve had to base my opinion on the excellent work of Ian Young, Andy Yan and others.
But after years of listening to claims that foreign buying is too insignificant to drive a market as big as Vancouver, I think I’ve found definitive proof. When housing markets are driven by easy financing and low mortgage rates, appreciation is higher for low-end, entry-level homes than it is for more expensive homes. Entry-level buyers are much more likely to max-out on debt than older, wealthier homeowners. This was the case in US bubble markets. For example, look at San Diego. Low-priced homes increased much more than high-priced properties.
This was also true during the first phase of the Vancouver bubble. Here is a scatter-plot generated from the April 2009 REBGV Stats Package, showing 5-year appreciation by price. It’s clear that lower priced properties appreciated more.

I then created the same plot using data from the most recent Stats Package, and the results are pretty startling. High-priced homes have appreciated much more than less expensive properties over the last 5 years.
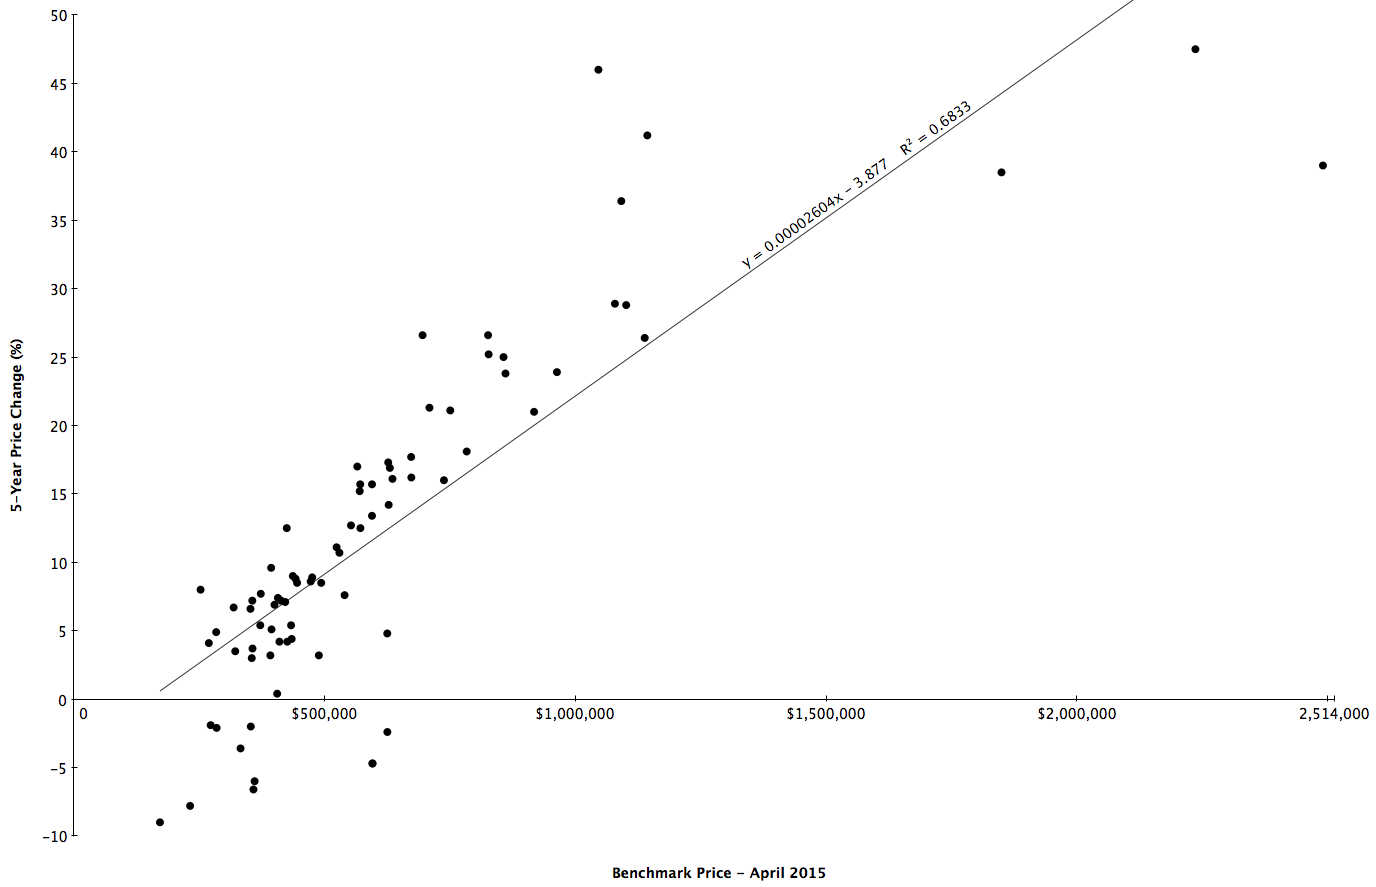
I can’t think of any realistic scenario where local Vancouverites were able to send this bubble into overdrive with the help of lower mortgage rates — especially when you consider CMHC no longer insures mortgages on homes sold for more than $1 million. The only plausible reason I have been able to come up with is that foreign buying is now the primary driver of the Vancouver housing bubble.
That Hissing Sound – Vancouver Edition
Back in 2005, as the US housing bubble started to pop, Paul Krugman wrote That Hissing Sound.
This is the way the bubble ends: not with a pop, but with a hiss.
Housing prices move much more slowly than stock prices. There are no Black Mondays, when prices fall 23 percent in a day. In fact, prices often keep rising for a while even after a housing boom goes bust.
So the news that the U.S. housing bubble is over won’t come in the form of plunging prices; it will come in the form of falling sales and rising inventory, as sellers try to get prices that buyers are no longer willing to pay. And the process may already have started.
It appears as though the process has now started in Vancouver. From the latest monthly report from the Real Estate Board of Greater Vancouver:
- Residential property sales were 2,853 in May – a 15.5% decline compared to May 2011.
- May sales were the lowest since 2001 and 21.1% below the 10-year May sales average.
- New listings totalled 6,927 in May 2012 – a 16.8% increase compared to May 2011.
- Last month’s new listing total was 15.3% above the 10-year average for listings in May.
- At 17,835, the total number of homes listed for sale increased 21% from this time last year.
Sales have stalled and inventory is rising. To make things worse, yesterday the Canadian government made major changes to mortgage rules.
- Mortgage amortizations were reduced from 30 years to 25.
- Refinancing limit reduced from 85% of home’s value to 80%.
- Gross Debt Service ratio reduced from 44% to 39%.
- Government insured mortgages now limited to homes purchased for under $1,000,000.
- Minimum down payment of 20% for homes priced above $1,000,000.
- Cash-back and stated-income (liar) loans eliminated.
- HELOC maximum reduced from 80% to 65%.
Also, consider that these mortgage rule changes are coming at a time of record low affordability. From RBC’s latest Housing Trends and Affordability report:

Any time the government tightens mortgage rules, it can have a negative effect on home prices. Coming at the same time as the market appears to be turning and with affordability at record lows, it will probably speed up the decline and could turn that hiss into a pop.
US Housing Has Bottomed
So says Bill McBride, author of Calculated Risk. In my opinion, his blog is the single best source for information on the US housing market. I’ve followed his blog for years, and can’t think of a single time he’s been wrong.
First there are two bottoms for housing. The first is for new home sales, housing starts and residential investment. The second bottom is for prices. Sometimes these bottoms can happen years apart.
For the economy and jobs, the bottom for housing starts and new home sales is more important than the bottom for prices. However individual homeowners and potential home buyers are naturally more interested in prices. So when we discuss a “bottom” for housing, we need to be clear on what we mean.
For new home sales and housing starts, it appears the bottom is in, and I expect an increase in both starts and sales in 2012.
And it now appears we can look for the bottom in prices. My guess is that nominal house prices, using the national repeat sales indexes and not seasonally adjusted, will bottom in March 2012.
There are several reasons I think that house prices are close to a bottom. First prices are close to normal looking at the price-to-rent ratio and real prices. Second the large decline in listed inventory means less downward pressure on house prices, and third, I think that several policy initiatives will lessen the pressure from distressed sales (the probable mortgage settlement, the HARP refinance program, and more).
Of course these are national price indexes and there will be significant variability across the country. Areas with a large backlog of distressed properties – especially some states with a judicial foreclosure process – will probably see further price declines.
And this doesn’t mean prices will increase significantly any time soon. Usually towards the end of a housing bust, nominal prices mostly move sideways for a few years, and real prices (adjusted for inflation) could even decline for another 2 or 3 years.
But most homeowners and home buyers focus on nominal prices and there is reasonable chance that the bottom is here.
Vancouver Housing Valuations
Writing about the San Diego housing market, Rich Toscano at Piggington’s Econo-Almanac has a great explanation of the historical relationships between house prices, incomes and rents.
Longtime readers know that I consider the price ratios to be absolutely fundamental to determining whether housing is fairly valued. It makes intuitive sense that home prices would tend to track incomes and rents: incomes, because they determine how much money people have available to pay for housing; and rents, because rent prices reflect how much San Diegans are willing and able to pay to put roofs over their heads when there is no speculative or investment element involved. The historical record bears out this intuitive logic, as San Diego’s home price-to-income and price-to-rent ratios have tended to be strongly mean-reverting over time.
He includes the following two graphs showing how San Diego’s ratios are now back to normal levels after the bursting of the housing bubble.


Here are the ratios for Vancouver:


The San Diego ratios were calculated with slightly different data, so the absolute numbers aren’t the same as Vancouver’s. However, today’s deviation from historical averages in Vancouver are comparable with the situation in San Diego in 2005.
So what is the likely future for home prices in Vancouver? Unless Vancouver is different, historical price-to-rent and price-to-income ratios will return at some point. Absent a significant jump in incomes and rents, the only way these ratios can get back to normal levels is with a very significant drop in prices. If this was to occur over the next couple of years, it would take a 40-50% fall. Like this:

The Insane Price of Canadian Real Estate
With all the information Canadians have heard about the US housing bubble and the incredible economic damage it’s bursting has caused, it’s hard to believe they would follow the same path – and yet they have. The average price of a Canadian home currently stands at $362,899 – about 70% more than in the US.
(Note: Canadian realtors typically report average prices while American realtors report median prices. Average home prices in the US are about 20-25% higher than median prices. The current median US price is $169,500 making the average US home approximately $210,000.)
 According to a recent article in The Economist, Canadian house prices are 29% overvalued relative to household incomes and a staggering 71% overvalued relative to rents.
Things are even worse in Vancouver, where the latest Demographia Housing Affordability Survey ranks Vancouver the 2nd least affordable city in the English speaking world. According to the survey, the median price of a home in Seattle was $321,500 while in Vancouver it was $602,000. In the year since that survey was published, Vancouver prices have gone up another 7.8% while Seattle has gone down 7.1% – making a home in Vancouver more than twice as expensive as a comparable home in Seattle. This is in light of the fact the two cities are similar in almost every way – including incomes.
How did things get so out of whack? Same way as they did in the US – with a debt fueled housing bubble. Lesson not learned.

How will the situation resolve itself? In all likelihood the correction will also follow the path of the US – a multi-year housing crash which ruins the lives of countless Canadians and takes down much of the economy with it.
